
Advent of 2023, Day 23 – Admin Portal in Fabric
This article is originally published at https://tomaztsql.wordpress.com
In this Microsoft Fabric series:
- Dec 01: What is Microsoft Fabric?
- Dec 02: Getting started with Microsoft Fabric
- Dec 03: What is lakehouse in Fabric?
- Dec 04: Delta lake and delta tables in Microsoft Fabric
- Dec 05: Getting data into lakehouse
- Dec 06: SQL Analytics endpoint
- Dec 07: SQL commands in SQL Analytics endpoint
- Dec 08: Using Lakehouse REST API
- Dec 09: Building custom environments
- Dec 10: Creating Job Spark definition
- Dec 11: Starting data science with Microsoft Fabric
- Dec 12: Creating data science experiments with Microsoft Fabric
- Dec 13: Creating ML Model with Microsoft Fabric
- Dec 14: Data warehouse with Microsoft Fabric
- Dec 15: Building warehouse with Microsoft Fabric
- Dec 16: Creating data pipelines for Fabric data warehouse
- Dec 17: Exploring Power BI in Microsoft Fabric
- Dec 18: Exploring Power BI in Microsoft Fabric
- Dec 19: Event streaming with Fabric
- Dec 20: Working with notebooks in Fabric
- Dec 21: Monitoring workspaces with Fabric
- Dec 22: Apps in Fabric
Admin portal serves purpose for governing and setting the Microsoft Fabric, where you can make tenant settings, also access the Microsoft 365 admin portal, and control how users interact with Microsoft Fabric.
To access the admin portal, not only you need a Fabric license but also admin rights with the following roles (in one of these roles; if you are not, you can only see Capacity setting in the admin portal):
- Global administrator
- Power Platform administrator
- Fabric administrator
Let’s check the settings offerings.
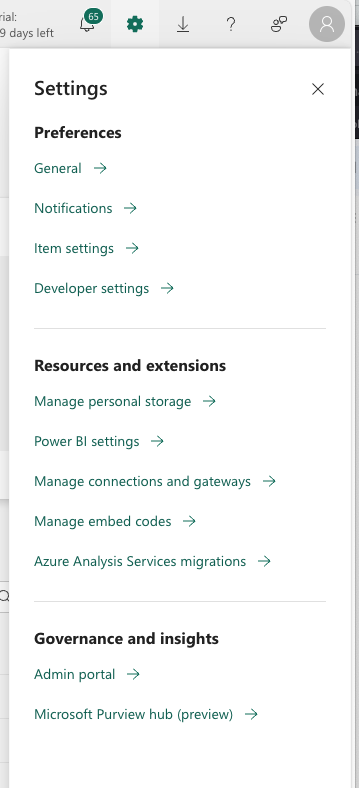
Preferences
In preferences you will mainly be able to select a language in your Fabric tenant, check the Power BI subscriptions and Power BI Alerts, and turn on (or off) the Power BI Developer mode. As well as turn on?off the use ArcGIS Maps for Power BI. You can also close the account, but must have admin priviledges.
Resources and extensions
Here you can manage your storage, manage Power BI settings, semantic models (query caching, refreshing, access, etc.), and workbooks, as well as dataflows.
Under managing data connections and gateways, you can add, edit or delete data connections, manage gateways (both on-premise and virtual network data gateways).
In Azure Analysis Services migration, you can do the migration from Azure Analysis services to Power BI Premium. It is a wizard that will help you get the migration done easier and faster.
Governance and insights
Under the Governance and insights, you will find the Admin portal and Microsoft Purview hub. We have briefly cover the Purview hub, and now let’s dig into Admin portal.
Admin Portal
Admin portal is where majority of important settings is done (one can say, “where magic happens”) 
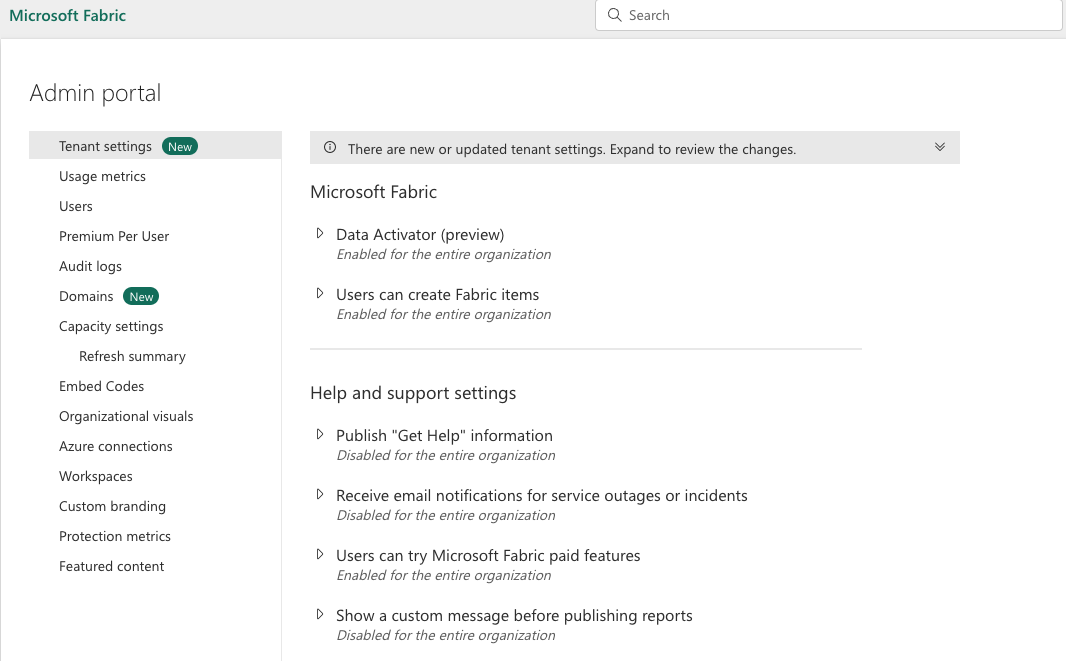
Tenant settings holds a lot of important setting and information. It has subsections and here they are:
- Microsoft Fabric: where you enable the items in Fabric; Data Activator can be enabled here with it’s purpose to set a specific set of rules and when they are met, users will be notified.
- Help and support settings: enable help within organization in Power BI, enable notifications for services outages, custom messages, trying new features and others,
- Workspace settings: enable semantic models across different workspaces, retention period on workspaces, settings for personal workspaces and how can create workspaces
- Information protection: settings on applying sensitivity labels and restricting content for exposing files to other services and tracking through Purview.
- Export and sharing settings: allowing Microsoft Entra B2B users to be guests in Fabric, enabling same browsing experience for guests, setting permissions for exporting to excel, HTML, word, and other formats, allowing access to featured tables, installing Power BI in Teams, allowing add-ins for Power BI and similar content
- App settings: enable users to create template apps that use semantic models built on one data source in Power BI Desktop, Enable to push apps to end users or to entire organization
- Integration settings: enable XMLA endpoints, ArcGIS maps in Power BI, global search for Power BI, Semantic model execution of queries using REST API, SSO for Dremio, Snowflake, Oracle, Redshift, Google BigQuery, Exporting data from semantic model to Onelake (yaaay!), storing semantic model tables in OneLake, viewing Power BI files saved in OneDrive an Sharepoint
- Power BI visuals: enabling visuals created in Power BI SDK for organization, allowing to download the custom visuals, use only certified visuals
- R and Python visuals settings: enabling use of R and Python in Power BI visuals
- Audit and usage settings: Enable metrics for content creators, enable per-user data usage for content creators, enable connection from Azure Log Analytics for workspace administrators
- Dashboard settings: enable web content on dashboard tiles
- Developer settings: enable embedding content in apps, Allow service principals to user Power BI APIs, allow creating user profiles, block Resourcekey Authentication
- Admin API settings: enabling for organisation use of APIs, response APIs with detailed metadata and with DAX and mashup expressions
- Gen1 dataflow settings: enable creation and use of Gen1 dataflows
- Template app settings: enable publishing template apps, installing template apps and installing template apps not listed in AppSource
- Q&A settings: enable semantic model owners to review questions people asked about their data, and allow to share Q&A synonyms with organization.
- Semantic Model Security: enable blocking republishing and refreshing packages and only allow the semantic model owner to publish updates
- Advanced networking: enable Azure private link and block public internet access
- Metrics settings: Enable creating and using Metrics for users in organization
- User experience experiments: enable that users will get minor user experience variations that the Power BI Team is experimenting with, such us content, layout, and design
- Insights settings: enable receiving notifications on top insights and entry points for insights
- Datamart settings: enabling who can create datamarts in organization
- Data model settings: enable users to edit data models in Power BI service
- Quick measure suggestions: enable quick measure suggestions, and enable user data to leave their geography (data processed in US and processing outside US).
- Scale-out settings: enable scalling-out queries for large semantic models
- OneLake settings: enable access for users to access data stored in OneLake with apps external to Fabric, and to sync data in OneLake with OneLake File Explorer app
- Git integration: enable synchronizing workspace items with user’s Git Repositories, exporting items to Git repositories in other geographical locations and export workspace items with applied sensitivity labels
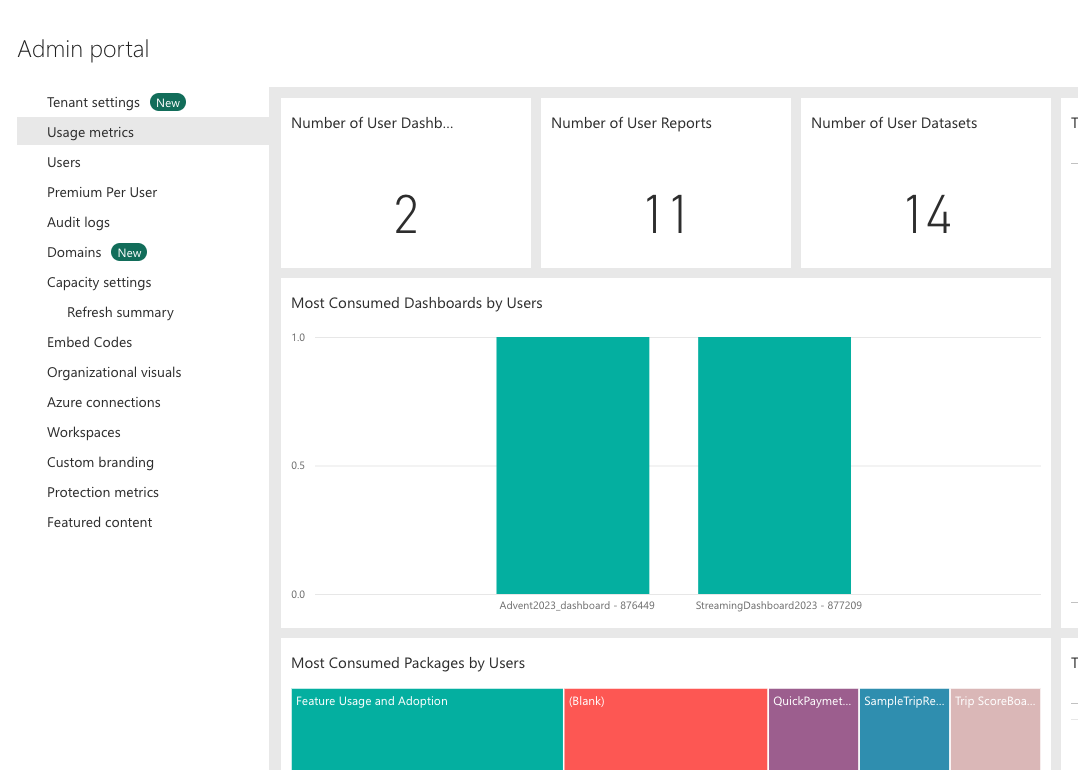
User Metrics is overview of items in workspace, user statistics and consumption by users.
Domains is a great way to tackle the grouping of all the data in an organization that is relevant to a particular area of field. When a workspace is associated with a domain, all the items in the workspace are also associated with the domain, and they receive a domain attribute as part of their metadata. This will give organization better overview for clarity, enable better federated governance (controlled on a domain-level and not only on tenant level), and spreading out the control to business departments.
Capacity settings is where you can define the Capacity SKU, capacity UNITS and regions to a particular roles, groups or units.
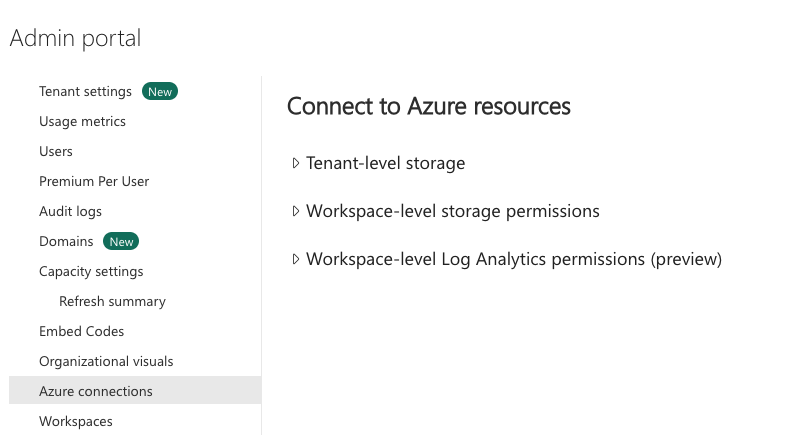
Azure connections is where you define where you can store your dataflows in your organizations’s ADLS Gen2 (Azure Data Lake Storage Gen2) account. You can set the Tenant-level storage or Workspace-level storage.
Data used in Power BI is stored in internal tenant-level storage, provided by Power BI. You can store your dataflows in ADLS Gen2 tenant-storage and access your dataflows using Azure portal, Azure Storage Explorer, and Azure APIs.
Custom branding – is where you can customize the look of Power BI for your organization.
Organizational visuals – is where you can manage Power BI visuals within your organization.
Embed codes – is where administrator can view, disable or delete the embed codes that are used for sharing reports publicly.
Protection metrics – is the report(s) for viewing Power BI sensitivity labels.
Users, Premium Per User, Audit Logs – all require Microsoft 365 Admin center access to check users, their access, Premium per User licences and Azure Logs.
Tomorrow we will look into OneLake concepts and definitions.
Complete set of code, documents, notebooks, and all of the materials will be available at the Github repository: https://github.com/tomaztk/Microsoft-Fabric
Happy Advent of 2023!
Thanks for visiting r-craft.org
This article is originally published at https://tomaztsql.wordpress.com
Please visit source website for post related comments.