
Advent of 2023, Day20 – Working with notebooks in Fabric
This article is originally published at https://tomaztsql.wordpress.com
In this Microsoft Fabric series:
- Dec 01: What is Microsoft Fabric?
- Dec 02: Getting started with Microsoft Fabric
- Dec 03: What is lakehouse in Fabric?
- Dec 04: Delta lake and delta tables in Microsoft Fabric
- Dec 05: Getting data into lakehouse
- Dec 06: SQL Analytics endpoint
- Dec 07: SQL commands in SQL Analytics endpoint
- Dec 08: Using Lakehouse REST API
- Dec 09: Building custom environments
- Dec 10: Creating Job Spark definition
- Dec 11: Starting data science with Microsoft Fabric
- Dec 12: Creating data science experiments with Microsoft Fabric
- Dec 13: Creating ML Model with Microsoft Fabric
- Dec 14: Data warehouse with Microsoft Fabric
- Dec 15: Building warehouse with Microsoft Fabric
- Dec 16: Creating data pipelines for Fabric data warehouse
- Dec 17: Exploring Power BI in Microsoft Fabric
- Dec 18: Exploring Power BI in Microsoft Fabric
- Dec 19: Event streaming with Fabric
Notebooks have been around for a long time and people, community, and professionals have proven the usability, practicality, versioning and reliability of notebooks. Not to mention the clarity and hygiene. But opinions are also divided.
The purpose of this post today is to check for a couple of functionalities that might not be that straightforward when it comes to notebooks.
Passing variables among notebooks
The usual way is to store the values in the session and later call the value using the %store. Within the notebook, this works like a charm and the “data” variable displays the value in the next cell.
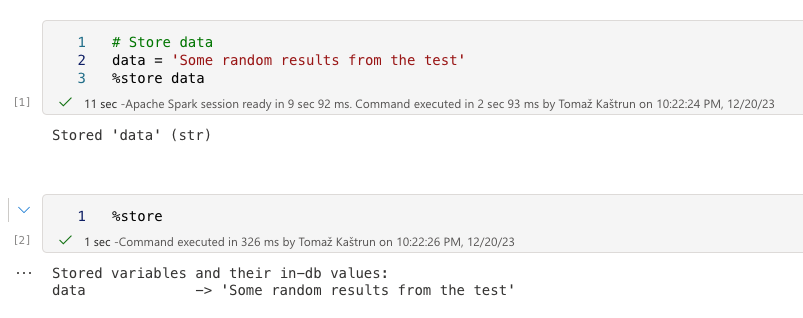
When called the %store from another notebook, the store is shown, but empty:

The traditional way can not be achieved this simple. However the intermediate results can be stored in a persistent file and later read.
Storing and reading from file
You can store the results in a file within Fabric. I will have the Spark session created and stored as a random data frame. The data frame must be a spark data frame (not e.g.: Pandas), so if the transformation is needed, you must do it.
import pandas as pd
from pyspark.sql import SparkSession

# Create SparkSession
spark = SparkSession.builder.master("local[1]") \
                    .appName('Day20_sample') \
                    .getOrCreate()


df = pd.DataFrame({'num_legs': [2, 4, 8, 0],
                   'num_wings': [2, 0, 0, 0],
                   'num_specimen_seen': [10, 2, 1, 8]},
                  index=['falcon', 'dog', 'spider', 'fish'])
dfs = spark.createDataFrame(df)

#dfs.show()
dfs.write.format("csv").mode('overwrite').save("abfss://[email protected]/a57xxxxxxxx02-d95e18c7128f/Files/animals.csv")
And the file is also shown in the folder list:

And this file can be later read in a simple manner. Note that a header and delimited are not included in this sample, but when dealing with real data, you should include these parameters as well.
df_from_CSV = spark.read.csv("abfss://[email protected]/a574xxxxxxxxxx128f/Files/animals.csv")
df_from_CSV.show()
Creating widgets
Widgets are great but with the lack of installations within Fabric, I – at the time of writing this blog post – could not have the package (ipywidgets) and the underlying engines (node.js) properly installed on Lakehouse in Fabric. I have used the simple Widget package. If I have missed out the way, or overlooked something, please be so kind as to post the solution in the comments section. 
I must note as well, that I have tried using the different spark sessions, environments and engines but could not get it up and running.
Dynamic graphs with sliders
Using matplotlib and widgets, you can set the graphs with sliders, that will be changes / regenerated, based on selection. And here is a simple example:
import matplotlib.pyplot as plt
from ipywidgets import interact
import numpy as np


def interactive_plot(amplitude, frequency):
    x = np.linspace(0, 2 * np.pi, 1000)
    y = amplitude * np.sin(frequency * x)
    plt.figure(figsize=(8, 4))
    plt.plot(x, y)
    plt.xlabel('X-axis')
    plt.ylabel('Y-axis')
    plt.title('Interactive Sine Wave')
    plt.grid(True)
    plt.show()
Once you have the graph initiated, you can run the interact function:
interact(interactive_plot, amplitude=(1, 5, 0.1), frequency=(1, 10, 0.1))
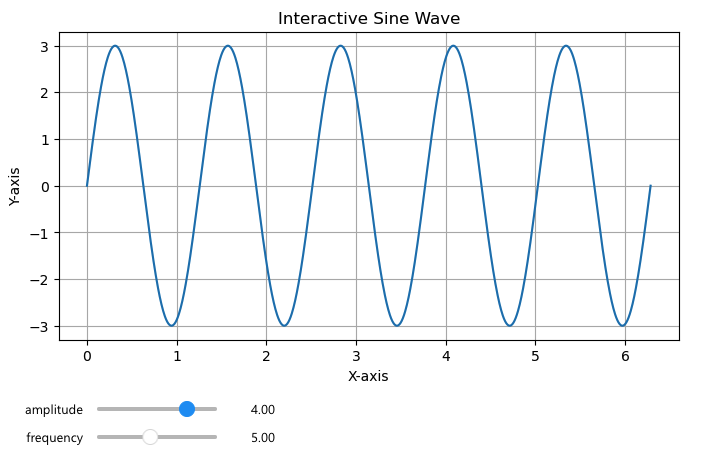
The two sliders: amplitude and frequency under the graph will re-render the graph, based on the slider selection.
Conclusion
I have been a fan of notebooks and worked with Jupyter Notebooks, R Quarto notebook, Databricks notebooks, and Julia-based Notebooks, and many different software (Markdown, Nteract, Visual Code,…) And cherry-picking the best features (most likely from quarto and Databricks), I have seen there is still much more room for improvement for Fabric notebooks. Just to name a few:
- passing variables between the notebooks
- setting up the master / main values from dropdown that get’s propagated to one cell (e.g.: graph or table) or complete notebook.
- better code interaction, code notation and results handling
- Results handling and switching between the result set displayed in dataframe and ability to transform dataframe to graph.
- Inline text writing
- Export the results or creating PDF, PPTX out of notebook
- Building a book / hub of all files and being able to add metadata to the notebook and “book-like” table of content would be very useful
Tomorrow we will look into monitoring of workspace.
Complete set of code, documents, notebooks, and all of the materials will be available at the Github repository: https://github.com/tomaztk/Microsoft-Fabric
Happy Advent of 2023!
Thanks for visiting r-craft.org
This article is originally published at https://tomaztsql.wordpress.com
Please visit source website for post related comments.