
Advent of 2023, Day 18 – Exploring Power BI in Microsoft Fabric
This article is originally published at https://tomaztsql.wordpress.com
In this Microsoft Fabric series:
- Dec 01: What is Microsoft Fabric?
- Dec 02: Getting started with Microsoft Fabric
- Dec 03: What is lakehouse in Fabric?
- Dec 04: Delta lake and delta tables in Microsoft Fabric
- Dec 05: Getting data into lakehouse
- Dec 06: SQL Analytics endpoint
- Dec 07: SQL commands in SQL Analytics endpoint
- Dec 08: Using Lakehouse REST API
- Dec 09: Building custom environments
- Dec 10: Creating Job Spark definition
- Dec 11: Starting data science with Microsoft Fabric
- Dec 12: Creating data science experiments with Microsoft Fabric
- Dec 13: Creating ML Model with Microsoft Fabric
- Dec 14: Data warehouse with Microsoft Fabric
- Dec 15: Building warehouse with Microsoft Fabric
- Dec 16: Creating data pipelines for Fabric data warehouse
- Dec 17: Exploring Power BI in Microsoft Fabric
We have created a Power BI report directly from the datalake and today we will check how to do same with dashboard and paginated reports.
Select new “Paginated report”. Select a data we want to connect to - in this case my “Advent2023_DWH” and click “Create paginated report”.

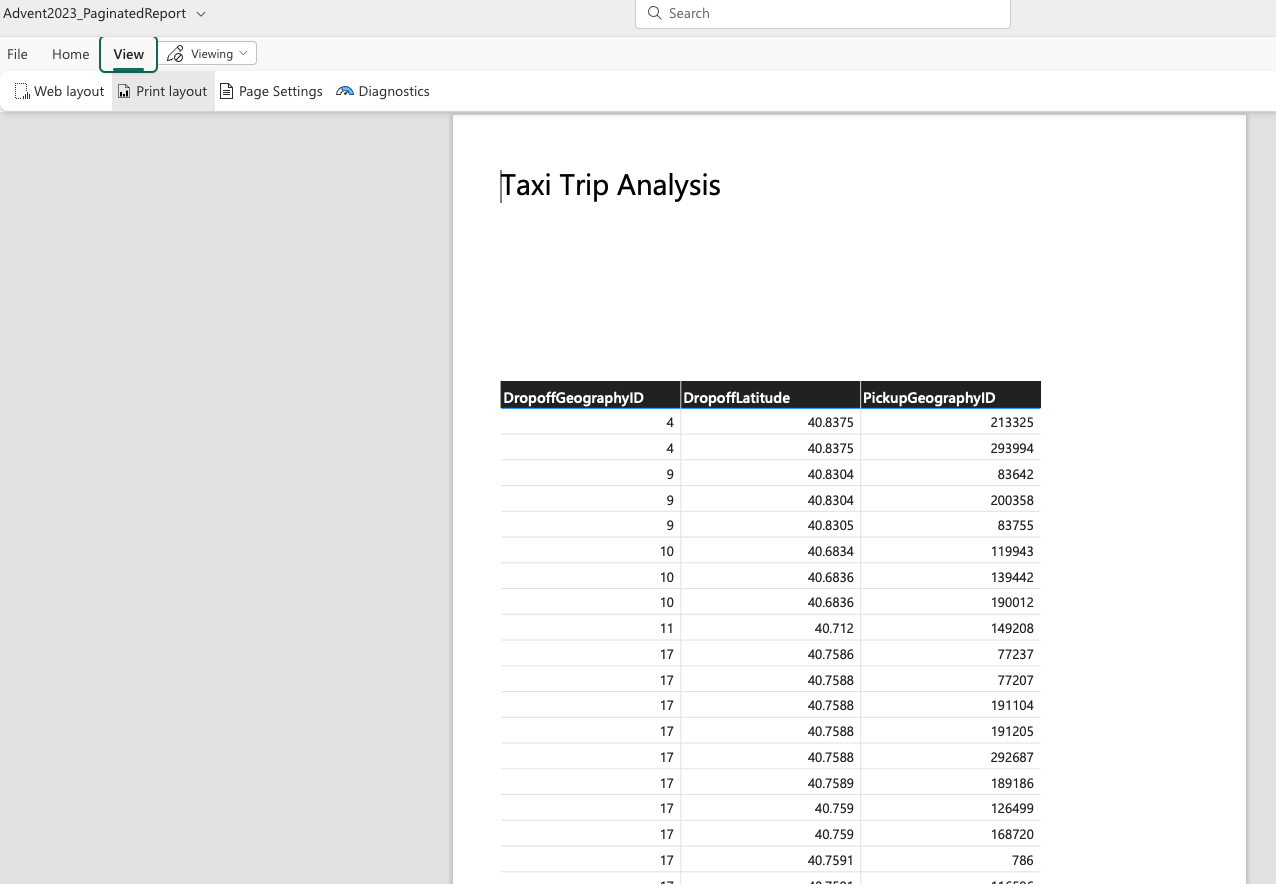
The familiar outlook, and start building the report. I have created a simple table view of data, to keep the report simple. You will see that the report creation is super simplified to the functionalities and capabilities you have, when using the Report builder. Once you create a report and give it a name. I am calling mine “Advent2023_PaginatedReport”.
Later, if you would like to update the report (as you can see, it does not contain more than just a table of transactional data), you will be greeted with the message:
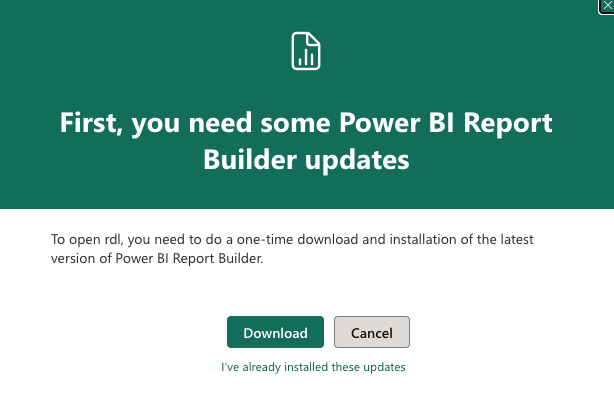
So, you will need to download the report first, install the Power BI report builder and do all the fine stuff in the report; like: parameters, filtering, adding other visuals, etc.
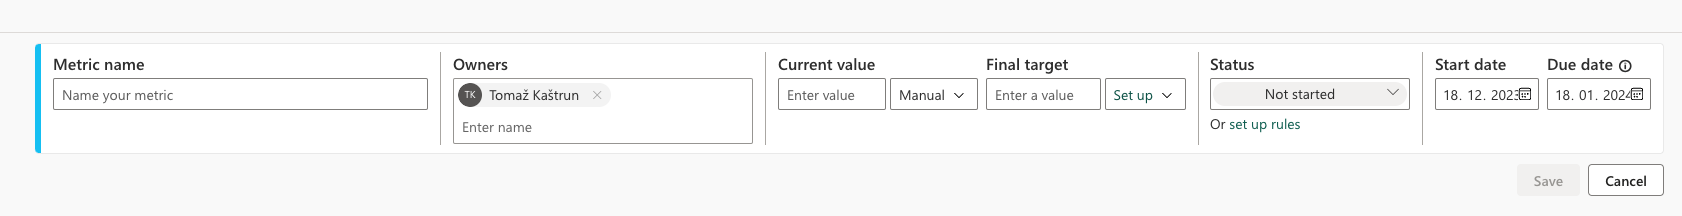
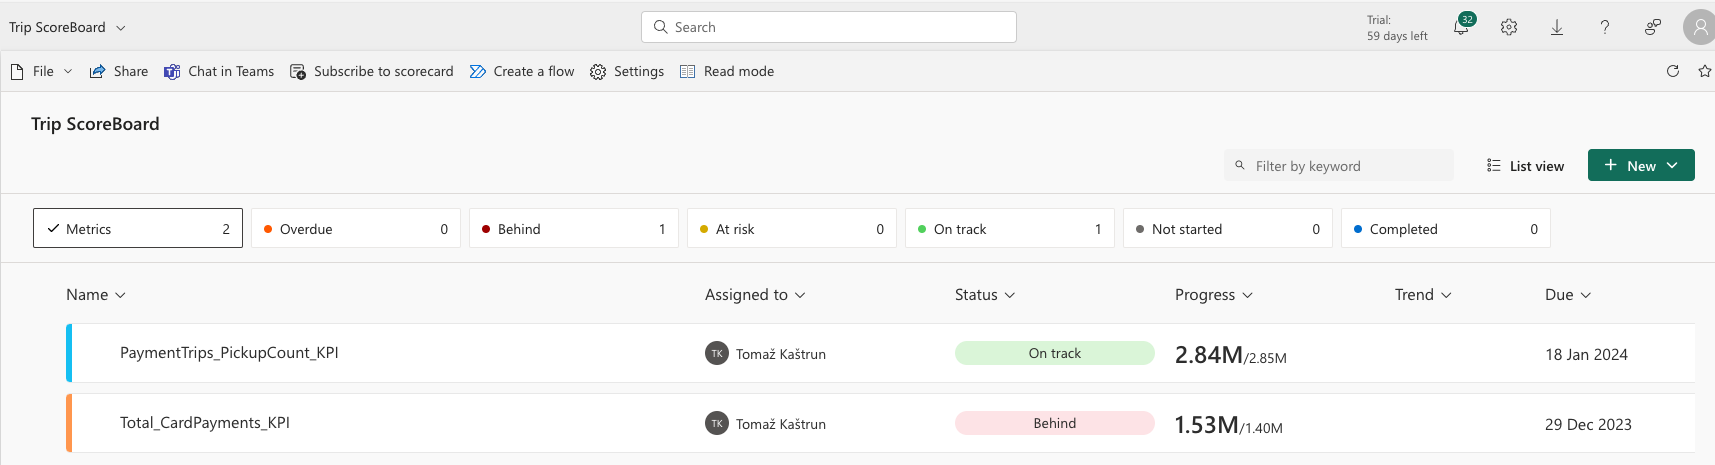
One can also create scorecard in Fabric. Scoreboard is a single pane view with one or more multiple metrics (KPI). Go to new and select “New scorecard”. You can create a single or multiple metrics for tracking key business objectives.
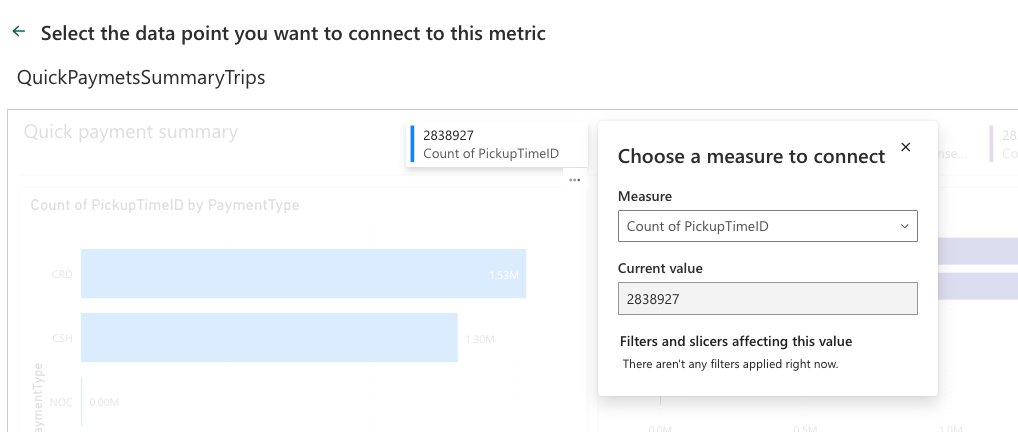
You will be able to assigning a metric / Scorecard to your semantic model. And instead of entering the values manually, I will connect the metric to data. So select “Connect to data” and find the value you want to extract and have it placed on a single pane among others:
Adding the final value you want the metric to be achieved and click save. I have added additional metric. And all are connected to the main
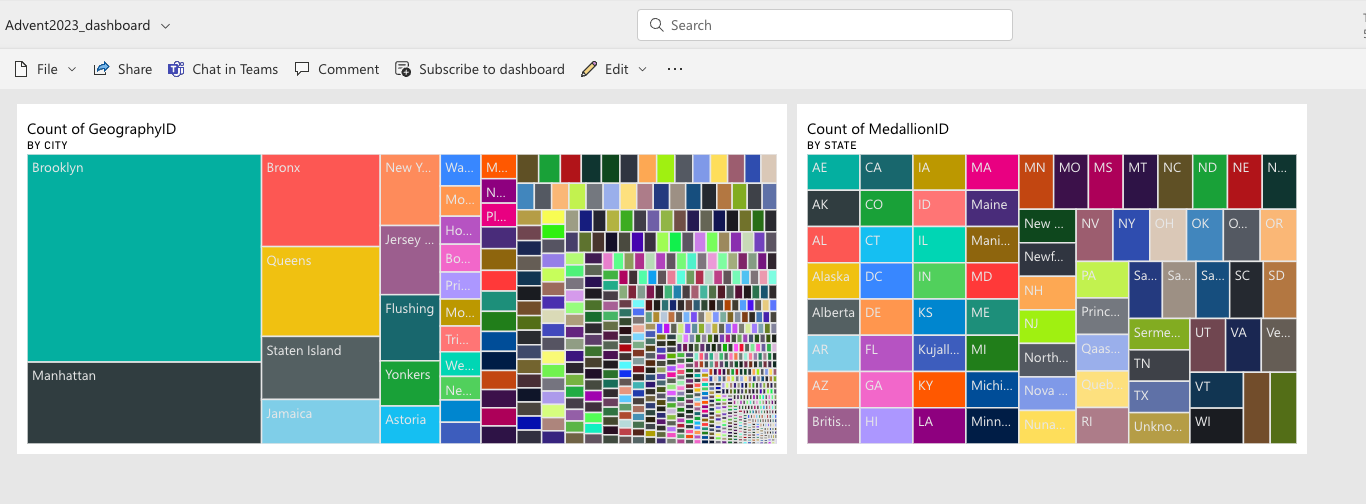
And lastly, the dashboard. The dashboard is a single page, often called a canvas and it gives one page information with well-selected tiles that can highlights the business story. Readers can view related reports for the details.
By adding tiles to dashboard, the simplest way is to open an already created Power BI and click the Pin icon to pin a visual and you can select the desired dashboard.
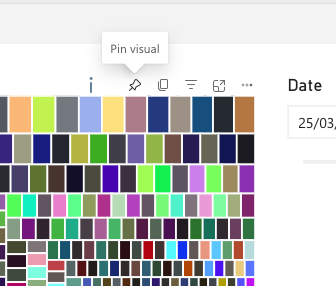
By doing so, you will be able to get the desired visuals from different reports on a one-page view.
Tomorrow we will looking into the event streaming.
Complete set of code, documents, notebooks, and all of the materials will be available at the Github repository: https://github.com/tomaztk/Microsoft-Fabric
Happy Advent of 2023! 
Thanks for visiting r-craft.org
This article is originally published at https://tomaztsql.wordpress.com
Please visit source website for post related comments.