Advent of 2020, Day 11 – Using Azure Databricks Notebooks with R Language for data analytics
This article is originally published at https://tomaztsql.wordpress.com
Series of Azure Databricks posts:
- Dec 01: What is Azure Databricks
- Dec 02: How to get started with Azure Databricks
- Dec 03: Getting to know the workspace and Azure Databricks platform
- Dec 04: Creating your first Azure Databricks cluster
- Dec 05: Understanding Azure Databricks cluster architecture, workers, drivers and jobs
- Dec 06: Importing and storing data to Azure Databricks
- Dec 07: Starting with Databricks notebooks and loading data to DBFS
- Dec 08: Using Databricks CLI and DBFS CLI for file upload
- Dec 09: Connect to Azure Blob storage using Notebooks in Azure Databricks
- Dec 10: Using Azure Databricks Notebooks with SQL for Data engineering tasks
We looked into SQL language and how to get some basic data preparation done. Today we will look into R and how to get started with data analytics.
Creating a data.frame (or getting data from SQL Table)
Create a new notebook (Name: Day11_R_AnalyticsTasks, Language: R) and let’s go. Now we will get data from SQL tables and DBFS files.
We will be using a database from Day10 and the table called temperature.
%sql
USE Day10;

SELECT * FROM temperature
For getting SQL query result into R data.frame, we will use SparkR package.
library(SparkR)
Getting Query results in R data frame (using SparkR R library)
temp_df <- sql("SELECT * FROM temperature")
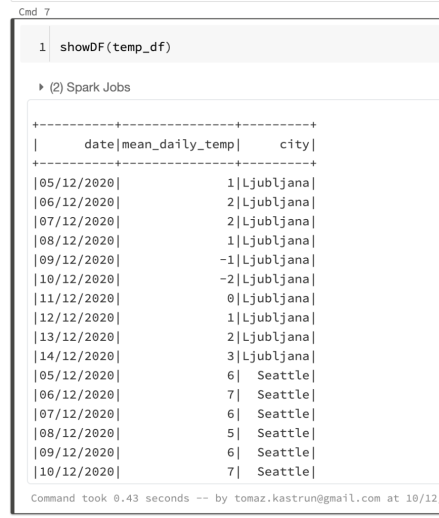
With this temp_df data.frame we can start using R or SparkR functions. For example viewing the content of the data.frame.
showDF(temp_df)

This is a SparkR data.frame. you can aslo create a R data.frame by using as.data.frame function.
df <- as.data.frame(temp_df)
Creating standard R data.frame and it can be used with any other R packages.
Importing CSV file into R data.frame
Another way to get data into R data.frame is to feed data from CSV file. And in this case, SparkR library will again come in handy. Once data in data.frame, it can be used with other R libraries.
Day6 <- read.df("dbfs:/FileStore/Day6Data_dbfs.csv", source = "csv", header="true", inferSchema = "true")
head(Day6)

Doing simple analysis and visualisations
Once data is available in data.frame and it can be used for analysis and visualisations. Let’s load ggplot2.
library(ggplot2)
p <- ggplot(df, aes(date, mean_daily_temp))
p <- p + geom_jitter() + facet_wrap(~city)
p
And make the graph smaller and give it a theme.
options(repr.plot.height = 500, repr.plot.res = 120)
p + geom_point(aes(color = city)) + geom_smooth() +
   theme_bw()

Once again, we can use other data wrangling packages. Both dplyr and ggplot2 are preinstalled on Databricks Cluster.
library(dplyr)
When you load a library, nothing might be returned as a result. In case of warning, Databricks will display the warnings. Dplyr package can be used as any other package absolutely normally, without any limitations.
df %>%
  dplyr::group_by(city) %>%
  dplyr::summarise(
       n = dplyr::n()
      ,mean_pos = mean(as.integer(df$mean_daily_temp))
 )
#%>% dplyr::filter( as.integer(df$date) > "2020/12/01")

But note(!), dplyr functions might not work, and it is due to the collision of function names with SparkR library. SparkR has same functions (arrange, between, coalesce, collect, contains, count, cume_dist,
dense_rank, desc, distinct, explain, filter, first, group_by, intersect, lag, last, lead, mutate, n, n_distinct, ntile,
percent_rank, rename, row_number, sample_frac, select, sql, summarize, union). In other to solve this collision, either detach (detach(“package:dplyr”)) the dplyr package, or we instance the package by: dplyr::summarise instead of just summarise.
Creating a simple linear regression
We can also use many of the R packages for data analysis, and in this case I will run simple regression, trying to predict the daily temperature. Simply run the regression function lm().
model <- lm(mean_daily_temp ~ city + date, data = df)
model
And run base r function summary() to get model insights.
summary(model)

confint(model)
In addition, you can directly install any missing or needed package in notebook (R engine and Databricks Runtime environment version should be applied). In this case, I am running a residualPlot() function from extra installed package car.
install.packages("car")
library(car)
residualPlot(model)

Azure Databricks will generate RMarkdown notebook when using R Language as Kernel language. If you want to create a IPython notebook, make Python as Kernel language and use %r for switching to R Language. Both RMarkdown notebook and HTML file (with included results) are included and available on Github.
Tomorrow we will check and explore how to use Python to do data engineering, but mostly the data analysis tasks. So, stay tuned.
Complete set of code and Notebooks will be available at the Github repository.
Happy Coding and Stay Healthy!
Thanks for visiting r-craft.org
This article is originally published at https://tomaztsql.wordpress.com
Please visit source website for post related comments.
